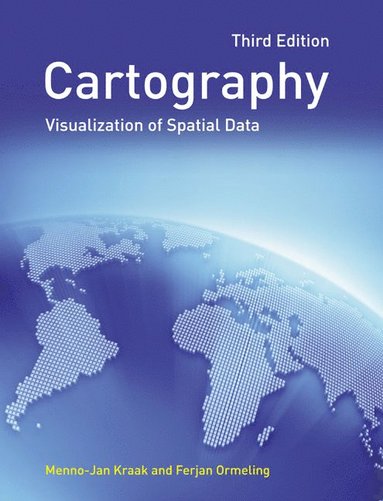
- Format
- Häftad (Paperback)
- Språk
- Engelska
- Antal sidor
- 248
- Utgivningsdatum
- 2009-11-19
- Upplaga
- 3
- Förlag
- Prentice Hall
- Medarbetare
- Ormeling, Ferjan
- Illustratör/Fotograf
- Illustrations
- Illustrationer
- Illustrations (some col.), maps (some col.)
- Dimensioner
- 244 x 188 x 15 mm
- Vikt
- Antal komponenter
- 1
- ISBN
- 9780273722793
- 454 g
Cartography
Visualization of Spatial Data
Kundrecensioner
Fler böcker av Menno-Jan Kraak
-
Mapping Time
Menno-Jan Kraak
Mapping Time: Illustrated by Minard's Map of Napoleon's Russian Campaign of 1812 considers the cartographic challenge of visualizing time on a map. Inspired by graphic innovator Charles Minard's classic map of France's disastrous invasion of Russi...
Övrig information
Menno-Jan Kraak is professor in Geovisualization at ITC, The International Institute of Geo-information Sciences and Earth Observation in Enschede, The Netherlands. Ferjan Ormeling is professor in Cartography at the Faculty of Geographical Sciences at Utrecht University, The Netherlands.
Innehållsförteckning
Contents
Preface
Acknowledgements
Chapter 1 Georgraphic information science and maps
1.1 The map as an interface
1.2 Geospatial data
1.3 Geographic information systems
1.4 Geospatial analysis operations
1.5 The spatial infrastructure and maps
Chapter 2 Data acquisition
2.1 The need to know acquisition methods
2.2 Vector file characteristics
2.3 Raster file characteristics
2.4 Deriving data from existing maps
2.5 Working with digital data
2.6 Control and accuracy
Chapter 3 Map characteristics
3.1 Maps are unique
3.2 Definitions of cartography
3.3 The cartographic communication process
3.4 Map functions and map types
Chapter 4 GIS applications: which map to use?
4.1 Maps and the nature of GIS applications
4.2 Cadastre and utilitites: use of large-scale maps
4.3 Geospatial analysis in geography: use of small-scale maps
4.4 Geospatial, thematic and temporal comparisons
Chapter 5 Map design and production
5.1 Introduction
5.2 Symbols to portray data related to points, lines, areas and volumes
5.3 Graphic variables
5.4 Conceptual and design aspects of text on the map
5.5 Requiremenets for the cartographic component of GIS packages
Chapter 6 Topography
6.1 Georeferencing
6.2 Map projections
6.3 Geometric transformations
6.4 Generalization
6.5 Relief
6.6 Topographic data: mapping and charting organizations
6.7 Geographical names
Chapter 7 Statistical mapping
7.1 Statistical surveys
7.2 Data analysis
7.3 Data classification
7.4 Catographical data analysis
7.5 Mapping methods
Chapter 8 Mapping time
8.1 Introduction
8.2 Mapping change
8.3 Animation
8.4 Dynamic variables
Chapter 9 Maps at work: presenting and using geospatial data in maps and atlases
9.1 Introduction
9.2 Paper atlases
9.3 Electronic atlases
9.4 Maps at work: map use functions
9.5 Working with (web-based) electronic atlases
Chapter 10 Maps at work: analysis and geovisualisation
10.1
10.2 Geovisual analytics
Chapter 11 Cartography at work: maps as decision tools
11.1 Again: why maps?
11.2 Management and documentation of spatial information
11.3 Outdated data: at work with the Digital Chart of the World
11.4 Acessibility: Cartography, GIS and geospatial information policy
11.5 Copyright and liability
11.6 Map use and usability
11.7 Maps and GIScience revisited
References
Index
Du kanske gillar
-
Hidden Spring
Mark Solms
B Format Paperback -
Orbital
Samantha Harvey
Häftad
